Author:
(1) Prakhyat Khati, Computer Science, University of Saskatchewa, Saskatoon, Canada ([email protected]).
Table of Links
3 Datasets and Experiment Setup
5 Discussion and Conclusions, and References
3. DATASETS AND EXPERIMENT SETUP
Different blockchain supports NFT trading, but we focus only on NFTs that are traded in the Ethereum blockchain network. Ethereum, as mentioned previously, is a public distributed ledger. All the transactions done are available publicly. But these transactions have a lot of metadata on them. We explored all the Datasets using the Google cloud big-query repository[35]. Google Bigquery is a data warehouse that can handle large-scale data and make it easy to access using SQL syntax. The data set consisted of 7 different NFT collection tables. We searched for information on the blockchain by directly accessing records(blocks) using a unique identifier (e.g., block ID, Transaction, wallets, and contract address). The file was stored in a comma-separated (CSV) file. The files include information such as truncation hash, address of the NFT smart contract, and the address of the wallet(s) or smart contract (both buyer and seller).
3.1 Extending the data set.
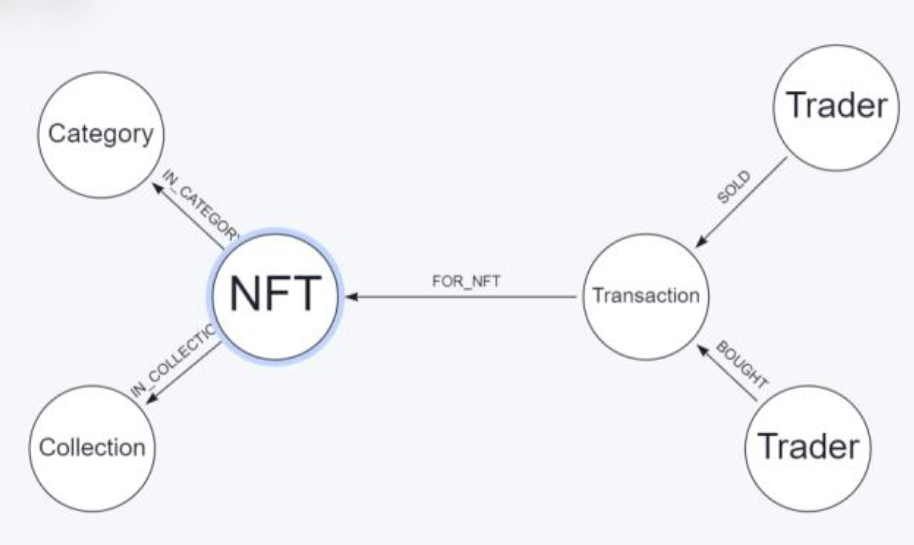
Alongside the dataset obtained from the big query, we also used two other datasets collection. One of the NFT collection data sets was used from a scientific report[27] done under the NFT revolution. This data is used to observe the transaction and visualize the NFT network. This is a huge data set, and it contains 6.5 million transactions for around 4.6 million NFTs. The NFTs are part of 4600 collections and 6 categories. Each transaction has a date and the price in crypto and USD; each transaction describes which NFT was sold. This is really huge data, so to dig deeper, we observed visualization on a subset of the dataset. The subset data set consists of transaction done in a single day, 2021-01-01, as even in a single day, there is quite a lot of transaction. This dataset was available in the .dump file only and needed to be imported using the neo4j desktop application as a database. So, a Graph schema model needs to be designed, and every column needs to be allocated to the respected nodes, as shown in Fig 1. Neo4j Data importer is used to import the data and create a graph model. Neo4j desktop version or Neo4j Aura, the web version, can handle such large data, and to query the dataset, Cypher is used. Neo4j handles the relational database efficiently and is quite a popular tool for bigdata analysis. Fig 2 is the updated version of the same graph schema that divides the Trader node into Buyer and Seller nodes.
Similarly, to calculate the NFT-CryptoPunks bubble prediction, the time series data is used. This data is retrieved from non-fungible. com[36]. The CSV file consists of two columns; one is the date, and the other one is the average weekly price. The time-series data is calculated for CryptoPunks only, and it is starting from mid-2018 to 2021. The price data is associated with the collection of the NFT rather than each NFT.

We consider the price of the NFT collection together rather than the individual NFTs. In other words, we assumed the NFTs are homogeneous for simplification. We will be using the LPPL model on the same data set.
This paper is available on arxiv under CC BY 4.0 DEED license.

